BNB price has started a downward correction from the $585 area. The price must remain above $570 to initiate further upside in the short term.
- BNB price started a fresh decline after failing to breach the $585 resistance zone.
- The price is now trading below $580 and the 100 simple moving average (4-hours).
- A key bullish trendline is forming with support near $570 on the hourly chart of the BNB/USD pair (data source from Binance).
- The pair could begin a further rise if it remains above the $570 support.
BNB price maintains support
After a decent increase, BNB price struggled to move closer to the $585 resistance. As a result, there was a bearish reaction below the $580 support, as Ethereum And Bitcoin.
The price fell below the $575 support and the 100 simple moving average (4-hours). It is trading as low as $571 and is currently consolidating its losses. There is also a key bullish trendline forming with support near $570 on the hourly chart of the BNB/USD pair.
There was a slight rise above the $575 level. The price crossed the 23.6% Fib retracement level of the downward move from the $586 high to $571 low. It is now trading below $580 and the 100 simple moving average (4-hours).
Immediate resistance is near the $578 level or the 50% Fibonacci retracement level of the downward move from the $586 high to $571 low. The next resistance lies near the $582 level.
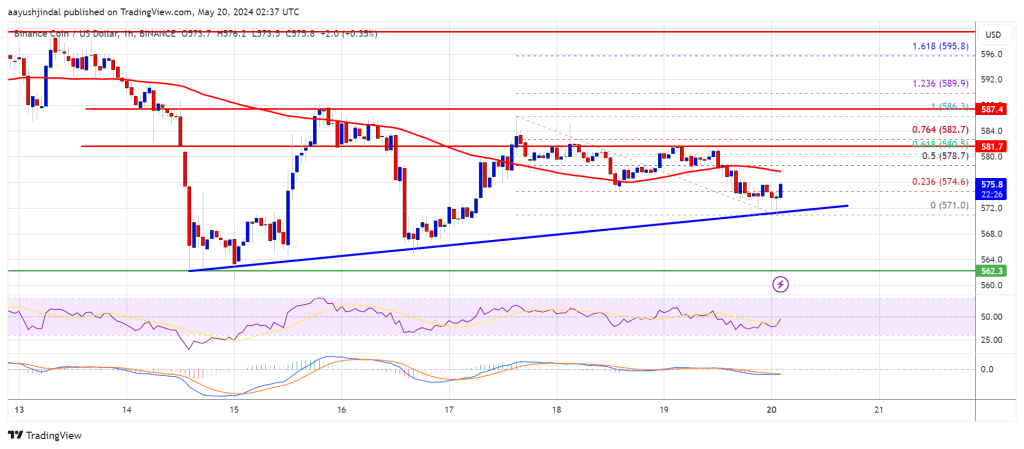
A sharp move above the $582 area could send the price higher. In the stated case, the BNB price could reach $588. A close above the $588 resistance could set the tone for a larger increase towards the $600 resistance. Any further gains may require a test of the $612 level in the coming days.
More losses?
If BNB fails to breach the $582 resistance, it could continue to decline. Initial downside support is near the $572 level and the trendline.
The next major support is near the $562 level. The main support lies at $550. If there is a downside break below the $550 support, the price could drop to the $532 support. Any further losses could initiate a further decline towards the $525 level.
Technical indicators
Hourly MACD – The MACD for BNB/USD is losing momentum in the bearish zone.
Hourly RSI (Relative Strength Index) – The RSI for BNB/USD is currently below the 50 level.
Key support levels – $572, $562 and $550.
Major resistance levels – $582, $588 and $600.