Dogecoin extended its losses and traded below the $0.1350 resistance zone against the US Dollar. DOGE is currently testing important support at $0.1200.
- DOGE gained bearish momentum below the $0.140 and $0.1350 levels against the US Dollar.
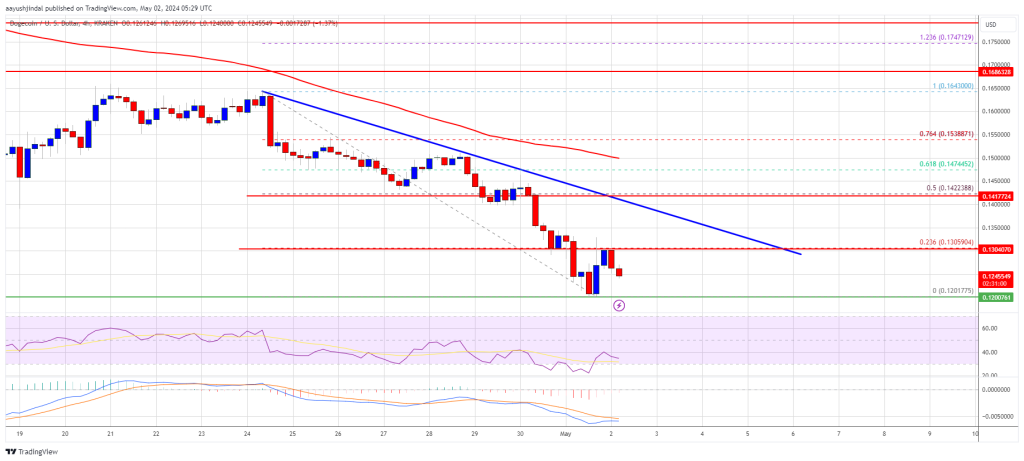
- The price is trading below the $0.1350 level and the 100 simple moving average (4-hours).
- A major downtrend line is forming with resistance at $0.1350 on the 4-hour chart of the DOGE/USD pair (data source from Kraken).
- The price must settle above $0.1420 to enter a positive zone and start a further rise.
Dogecoin price extends losses
After closing below $0.150, Dogecoin price extended its losses and entered a short-term bearish zone, as Bitcoin And Ethereum. There was a decline below the $0.1350 support zone.
A low formed at $0.1201 and DOGE is now consolidating its losses. There was a slight wave of recovery above the $0.1250 level. The price tested the 23.6% Fib retracement level of the downward move from the $0.1640 high to $0.1201 low.
However, the bears protected more gains above the $0.130 resistance. Dogecoin is also below the $0.1420 level and the 100 simple moving average (4-hours). On the upside, the price faces resistance near the $0.130 level.
Source: DOGEUSD on TradingView.com
The next major resistance is near the $0.1350 level. There is also a major downtrend line forming with resistance at $0.1350 on the 4-hour chart of the DOGE/USD pair. The main obstacle lies at $0.1420. A close above the $0.1420 resistance and the 50% Fibonacci retracement level of the downward move from the $0.1640 high to $0.1201 low could send the price towards the resistance of $0.1550. Any further gains could push the price towards the $0.1620 level.
More losses in DOGE?
If DOGE price fails to rise above the $0.1350 level, it could begin a further decline. Initial support on the downside is near the $0.1220 level.
The next major support is near the $0.120 level. If there is a downward break below the $0.120 support, the price could decline further. In the indicated case, the price could decline to the level of $0.1040.
Technical indicators
4-hour MACD – The MACD for DOGE/USD is now gaining momentum in the bearish zone.
4-hour RSI (Relative Strength Index) – The RSI for DOGE/USD is now below the 50 level.
Key support levels – $0.1240, $0.1200 and $0.1040.
Major resistance levels – $0.1300, $0.1350 and $0.1420.
Disclaimer: The article is provided for educational purposes only. It does not represent the opinions of NewsBTC on whether to buy, sell or hold investments and, naturally, investing involves risks. You are advised to carry out your own research before making any investment decision. Use the information provided on this website entirely at your own risk.