
Dogecoin corrected its gains and tested the $0.150 zone against the US dollar. DOGE now forms a base and could begin a further increase above $0.1520.
- DOGE price surged as high as $0.160 before correcting gains.
- The price is trading above the $0.150 level and the 100 hourly simple moving average.
- There is a key bullish trend line forming with support at $0.1485 on the hourly chart of the DOGE/USD pair (data source from Kraken).
- The price must settle above $0.1540 to enter a positive zone and start a further rise.
Dogecoin price maintains support
After a steady increase, Dogecoin price faced resistance near the $0.160 area. A high formed at $0.1594 before DOGE initiated a downward correction as Bitcoin And Ethereum. There was a decline below the $0.1540 support area.
A low formed at $0.1488 and DOGE is now consolidating for the next move. Dogecoin is still trading above the $0.150 level and the 100 hourly simple moving average. There is also a key bullish trend line forming with support at $0.1485 on the hourly chart of the DOGE/USD pair.
On the upside, the price faces resistance near the $0.1515 level. It is near the 23.6% Fibonacci retracement level of the downward move from the $0.1594 high to $0.1488 low.
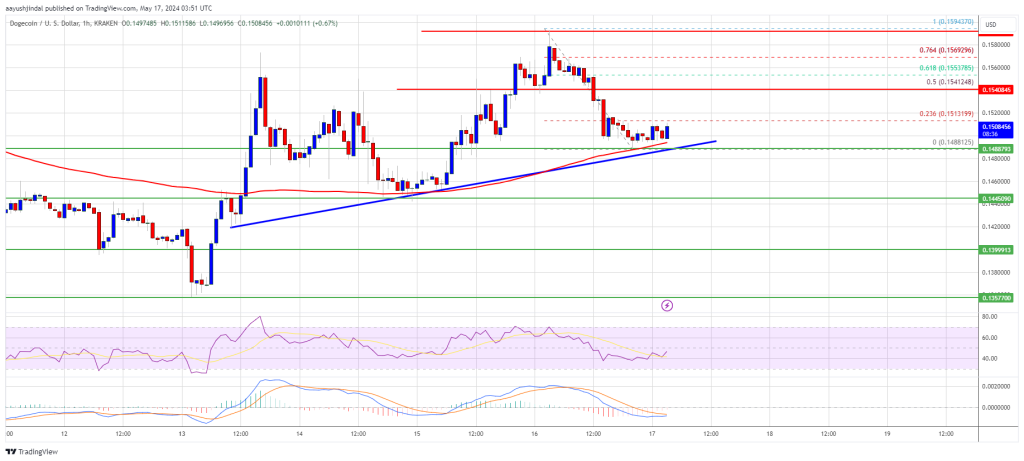
The next major resistance is near the $0.1540 level or the 50% Fibonacci retracement level of the downward move from the $0.1594 high to $0.1488 low. A close above the $0.1540 resistance could send the price towards the $0.160 resistance. Any further gains could push the price towards the $0.1650 level. The next major stop for the bulls could be $0.1720.
More losses in DOGE?
If DOGE price fails to rise above the $0.1540 level, it could begin a further decline. Initial support on the downside is near the $0.150 level and the trendline.
The next major support is near the $0.1445 level. If there is a downward break below the $0.1445 support, the price could decline further. In the indicated case, the price could decline to the $0.1350 level.
Technical indicators
Hourly MACD – The MACD for DOGE/USD is now losing momentum in the bearish zone.
Hourly RSI (Relative Strength Index) – The RSI for DOGE/USD is now above the 50 level.
Key support levels – $0.1500, $0.1445 and $0.1350.
Major resistance levels – $0.1515, $0.1540 and $0.1600.