
Solana attempted a recovery wave above the $140 level. SOL price is now struggling to break above the $160 and $170 resistance levels.
- SOL price recovered and tested the $160 resistance against the US Dollar.
- The price is now trading below $160 and the 100 simple moving average (4-hours).
- A key bullish trendline is forming with support at $146 on the 4-hour chart of SOL/USD (data source from Kraken).
- The pair could begin a further decline if it stays below $160 and $170 for long.
Solana price faces resistance
Solana price began a significant decline below the $170 and $160 support levels. SOL tested the $115 zone and recently started an upward correction, as Bitcoin And Ethereum.
There was a decent increase above the $130 and $140 levels. The price climbed above the 23.6% Fibonacci retracement level of the descending wave from the $205 high to $115 low. It even surpassed the $155 area and the 100 simple moving average (4-hours).
However, the bears are active near the $160 area and the 50% Fibonacci retracement level of the descending wave from the $205 high to $115 low. The price has struggled and corrected gains.
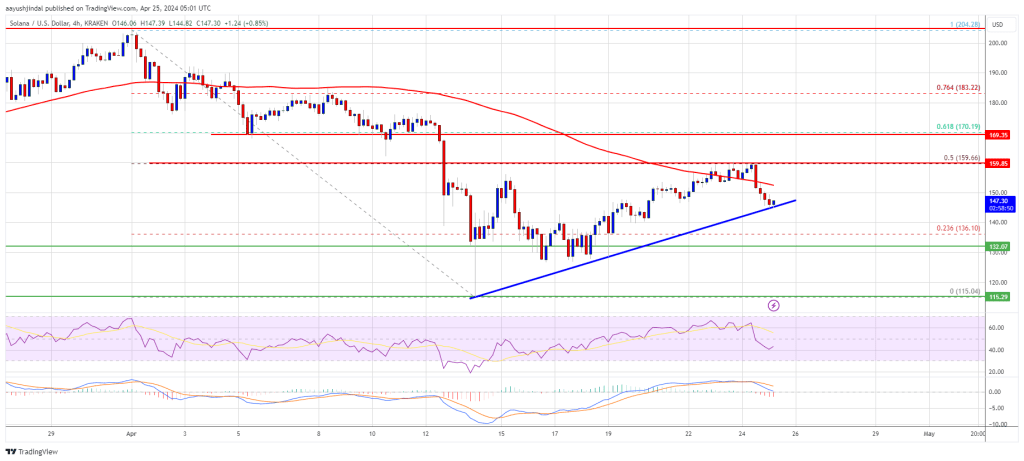
Source: SOLUSD on TradingView.com
Solana is now trading below $160 and the 100 simple moving average (4-hours). There is also a key bullish trendline forming with support at $146 on the 4-hour chart of the SOL/USD pair. Immediate resistance is near the $155 level. The next major resistance is near the $160 level. A successful close above the $160 resistance could set the tone for another major rise. The next key resistance is near $170. Any further gains could push the price towards the $188 level.
Another decline in SOL?
If SOL fails to move above the $160 resistance, it could begin a further decline. Initial downside support is near the $145 level and the trendline.
The first major support is near the $132 level, below which the price could test $120. If there is a close below the $120 support, the price could decline to the $100 support in the near term.
Technical indicators
4-hour MACD – The MACD for SOL/USD is accelerating into the bearish zone.
4-hour RSI (Relative Strength Index) – The RSI for SOL/USD is below the 50 level.
Key support levels – $146 and $132.
Major resistance levels – $155, $160 and $170.
Disclaimer: The article is provided for educational purposes only. It does not represent the opinions of NewsBTC on whether to buy, sell or hold investments and, naturally, investing involves risks. You are advised to carry out your own research before making any investment decision. Use the information provided on this website entirely at your own risk.